FORWARD
The following is a description of the latest version of the Index Test Box
(ITB) and its capability as an instrument to advance the state of the art in
monitoring hydroelectric generating units. It is designed to optimize the
performance of individual generating units powered by either Kaplan or Francis
turbines and to monitor their performance and alert an operator whenever there
is a degradation in performance that indicates a need for maintenance. The
original device was developed to be connected to the governor and in an
unattended manner to collect operational data and sort the data for
analysis. It was field tested several times and compared to manually
conducted index tests and found to work perfectly. In fact, it produced
data with virtually no uncertainty or scatter.
The
instrumentation technician invented the software while working at Woodward
Governor Company. Evaluation of signal composition in the frequency domain led
to the development of a nonlinear digital filter to glean steady-state data
from the noisy continuous data streams emanating from the machine.
Unfortunately, the ITB project did not achieve commercial success for Woodward
Governor Company. Some familiarity at index testing is necessary to fully
appreciate the ITB’s accuracy and laborsaving value. There are scant few
engineers with such expertise, especially in management/procurement positions.
Development
work continued on the device, particularly on the aspect of being able to feed
recorded data from the power station SCADA (Supervisory Control and Data
Acquisition System) directly into the ITB as though it was actual field
data. Playback is sped up to over 100 times normal speed. The sorting
process to decide what to keep and what is too noisy is fully automated. This
remote index testing capability was demonstrated to function perfectly in the
Dorena field-tests for index testing a Kaplan turbine. A long-term condition
monitoring system is available to track operational performance of generating
units over time so that maintenance may be scheduled on an as needed basis.
Lee
Sheldon, P.E.
The Index Test Box
and Hybrid Index Testing Method are Diagnostic Tools for Optimizing and
Condition Monitoring of Hydroelectric Turbines
Abstract
The
Index Test Box (ITB) and Hybrid Index Testing (HIT) method combine to become
HIT/ITB; a Diagnostic Tool for Index Testing and Optimizing Kaplan Turbine 3-D
Cam Surfaces and Condition Monitoring of Hydroelectric Turbines.
The
ITB was developed as an accessory for Woodward’s 505-H Kaplan governor to
collect field data for index testing.
Available
diagnostics are dual purpose and multi-function. The first purpose is to
check-out the governor, 3-D Cam (if the turbine is a Kaplan) and
electro-hydraulic actuators to verify the control system is working properly.
The second is turbine efficiency analysis and index testing to optimize Kaplan
turbine 3-D Cam surfaces and capture overall efficiency profiles for input to
Type-2 optimization systems. The greatest advantages of the ITB and HIT Method
for index testing are cost and time saving and improved data coherence and
elimination of the drudgery of capturing field data by hand.
Scope
This
proposal covers only Kaplan and Francis turbine index testing, optimization and
condition monitoring. It is most likely this methodology will work on a Pelton
type as well, but won’t claim it until it’s been done.
The
foci of this proposal are index testing
to:
·
Tune-up individual Kaplan turbine
head and gate to blade 3-D Cam data surfaces to maximize its individual
operating efficiency all across its operating envelope.
·
Capture an on-cam gate-sweep to
characterize the Overall Efficiency Profile for input to a higher-level
powerplant-wide optimization scheme.
·
Define the baseline benchmark for
comparison during subsequent trending of operating efficiency.
·
Condition monitoring to alarm the
operators if operating efficiency gets out of limits.
The
purpose ofthis is to introduce the HIT method and the
ITB, which is a test instrument especially designed for tuning-up and
monitoring hydroelectric turbines. The ITB is used to evaluate governor and
blade control system operation and aid in setup, calibration, maintenance and
monitoring of these machines. The ITB is an instrument created at Woodward
Governor Company in 1984 to facilitate installation, commissioning and
diagnosis of hydroelectric turbine control systems by providing a means of
getting better field data back to the engineers at Woodward when problems
arise. Although the ITB was always found to be a useful tool for collecting
field data for optimizing Kaplan turbines it was not a commercial success for
Woodward.
Although
it was originally designed for Kaplan turbines the ITB can be used on any type
of hydroelectric generator. the original work assignment for the ITB project
was when Woodward’s hydro engineering manager, George Mittendorf* handing me a
copy of Lee
Sheldon’s 1982 tutorial on Kaplan index testing and optimization with the
directive, “Make us something that does this.” George said to do the Kaplan
turbine first, the rest of them will be easy after the ITB can do a Kaplan.
*(Woodward Hydro Engineering Manager in
1984 is credited twice in the current
2011 ASME PTC-18 Standards and PTC-18 Committees pg. viii)
The
ITB is a labor-saving data collection tool designed as an accessory to
Woodward’s Kaplan governor. The ITB has been validated by parallel
field-testing with conventional index tests on 5-separate occasions. Each field
test validation consists of:
1.
using the ITB to index test a Kaplan
turbine at a single head to derive the overall efficiency curve and optimize,
or tune-up the 3-D Can head and gate to blade surface,
2.
repeat the index test and
optimization using the traditional testing methods and then
3.
the results were compared and
evaluated by government hydropower experts.
Each
and every time the ITB results were deemed to be in full agreement with the
traditional method.
ITB
Features and Functions
·
Stripchart recorder
·
X-Y Plotter
·
SteadyState filter
·
Remote Viewing of data
·
All standard PC-type utilities are
still available
Introduction
The
most recent developments to the ITB are a 5th successful field-test
to validate both the ITB and the new HIT method for index testing a Kaplan
turbine. In this new era of Social Distancing, crowd avoidance and other
biological exposure concerns, a way to remotely index test and diagnose
hydroelectric turbine control systems (i.e. without going to the dam) would be
a welcome addition to a control-engineer’s tool kit. This is precisely what the
Index Test Box (ITB) and Hybrid Index Testing (HIT) method are for... The
Canada/US Border is expected to be closed for months to come. This remote
testing capability will become handy to have at some point when it is needed
most. The ITB was originally designed as a maintenance tool to be used by
Woodward’s hydro engineering department to get diagnostic field-data instantly
viewable back in the shop during troublesome startups. In today’s contagion
conscious climate, it would be helpful to be able to index test and diagnose
control system problems across-borders without the hassles of crossing borders.
With the ITB and Internet communications this capability exists now and can
reach out to anywhere in the world.
How
HIT Works
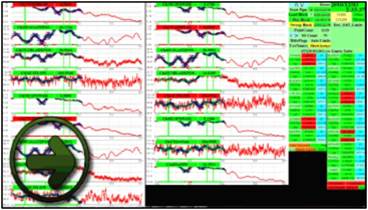
Figure 1 Click Image to see a short video about the ITB at a
3-unit plant in Canada.
The
HIT method permanently reconfigures the powerplant’s existing instrumentation,
SCADA system and datalogger to set up for turbine efficiency measurements. By
maintaining NIST
Traceability*
on all sensors at all times, an index test can be performed at any time and
trended back to the initial benchmark data to evaluate degradation when
considering refurbishment.
Every
scan of data is of excellent quality and suitable for index testing and
optimization.
The
HIT Method breaks-down the setup steps for an index test so it can be
accomplished as a series of routine task-orders carried out by regular
powerplant personnel during the normal daily work schedule. This alleviates the
need for index-testing specialists to go to a dam to setup and execute an index
test and reduces out-of-pocket costs for an index test by approximately 90%.
According
to Lee, the reduced data from the ITB has less scatter than traditionally
collected index test data. A side benefit of the HIT method is that the
powerplant personnel get greater familiarity with the optimization methods and
equipment to perform index testing field work. When the setup is complete,
execution of an index test becomes a simple task for the operators to perform
as a scheduled task somewhere between annually and quinquennially. Routine
maintenance of the instrumentation will maintain NIST Traceability on all
sensors used for the index test measurements so every scan of data is equally
accurate and valid as any other.
The
workload to run an index test
Running
an index test using the HIT method is not difficult or all-engaging. An index
test consists of 25 or more manual setpoints for gates and blades with an
8-minute dwell at each gate-blade position pair. Assume 10 minutes per test
point for these estimates. Total time for task-order – 10 minutes each for 25
test pointes = 250 minutes = 4.1 Hours. While running the test, the operator
does not need to record any data or calculate any answers, just set the gates
and blades and wait 8 minutes while the datalogger records scans to memory. (In
truth, with the HIT method the two most important accessories for running an
index test will become a minute-timer and a book or magazines to read while
waiting for the next data point.)
Exercising
the turbine for an index test would best be accomplished by an automatic
programmed cycle in the turbine control system. (This was how it was planned at
Woodward, but office politics…) It could be A virtual “Drum-Program” created in
software to output setpoints to gates and blades automatically on a time
schedule. The Drum Program code could reside in either the SCADA system or the
governor PLC. This process reduces the cost of a Kaplan turbine index test to
1/10th the cost of a traditional index test.
ITB
Is Now a Service Over the Internet
The
ITB in 2020 has evolved into a service over the Internet. The powerplant
personnel get a checklist of signals to setup and a set of gate-blade pairs to
execute and all the Internet and telephone assistance they need to get the test
up-and-running. No out of pocket expenses are incurred for the setup and
data collection parts of the index test because the powerplant’s own equipment
and personnel are used exclusively throughout. The customer only pays ATECo for
the data reduction and analysis work that ATECo actually does.
The
data files recorded during execution of the gate-blade pairs are uploaded to
ATECo for analysis and reduction to a new optimum 3-D Cam surface that will
achieve the highest possible efficiency from the unit under any conditions of
head and flow. After the new 3-D Cam surface is installed in the machine
another on-cam sweep of the machine is analyzed to verify results. The final
test report will quantify the efficiency improvements from the index testing
and optimization procedures.
Index
testing using the HIT Method is a neat, clean no-travel-required way to
maximize electrical output while minimizing environmental harm and wear and
tear on the turbines.
Remote
Testing Method
Field-testing
experience with the ITB and hydro-electric turbines has revealed a better way
to index test a turbine that does not require that the test engineers go to the
dam to run the test personally, saving both money and time. Today with viral
exposure concerns everywhere the alleviation of any need to go anywhere is a
plus. The Hybrid Index Testing (HIT) method of index testing has evolved as a
natural progression of form follows function. The original reason that remote
index testing was needed was to get one-way data communication from the
powerplant’s SCADA system into the ITB with no possibility of a computer virus
getting fed back into the SCADA system from the ITB. The no-go-to-the-dam
feature is especially desirous in these days of social distancing to avoid
potential exposure to infectious viruses and such. (Who’d a thunk that 14 years
later the anti-computer-virus technique would become useful again, but this
time to protect from biological viruses? The HIT method will work equally
well for this situation.)
A
happy circumstance in this is that by saving many thousands on logistics
(travel, lodging meals etc.) and getting back the travel time normally spent
going to and coming from the dams, many more turbines can be index tested and
optimized within the same Maintenance Budget.
Using
this new Hybrid Index Testing (HIT) method all index testing can be
accomplished from a central location working with either live over the
internet data or canned pre-recorded data.
If
the governors were programmed to execute the set of gate-blade pairs designated
for the index-test, an automatic index test could be accomplished.
Remote
Viewing of Data
·
The technician the field sets up the
instrumentation and data recorder, exercises the machine while collecting the
data. Data is offloaded to a thumbdrive and then is uploaded to the ITB located
back at the shop. The data can be played back in the ITB in the shop and the
engineers there can see the stripchart and X-Y Graph displays with only a few
minutes delay.
·
If the ITB in the field is allowed
to be connected to the Internet while connected to the hydro unit, it’s display
can be ported to the ITB back in the shop and the engineers there can see it
live at the same time.
The
SteadyState detector
What
makes remote index testing possible is the SteadyState algorithm that is the
key-element in the ITB program, a non-linear digital filter designed in the
frequency domain to sift through the dense spectral content in the time domain.
This
non-linear algorithm was written specifically for this purpose utilizing a
2-pass statistical analysis routine comprised of Linear Regression (LR) and
Standard Deviation (SD) calculations to quantify slope (SteadyState-ness)
and SD (Noisiness) values as “figures of merit” for the average value.
Comparison
of the Slope and SD values to preset limits determines if the unit is running,
“steady-state.” Data points captured and deemed to be steady-state are renamed
“SteadyState data points.”
SteadyState
data is collated into a separate data file for subsequent reduction to a new
3-D Cam surface by hand.
The
SteadyState data gleaned by this process is delivered in the same format as the
traditional method data.
SteadyState
Algorithm
utilizing
Linear Regression (Slope) and Standard Deviation (SD) to “SteadyState-ness” of
a data point. A SteadyState data point consists of an average value accompanied
by Slope and SD values as “figures of merit.” The Slope and SD are compared to
operator preset limits to sort the SteadyState data from the noisy continuous
data streams.
The
HIT method index test at Dorena is the example being put forward now to show
how your Kaplans can be optimized.
Why
these tests were run at Dorena
These
tests were wanted by the new owners when this recently commissioned generating
equipment changed hands. In addition to the seller hiring ATECo to index test
the unit 4-times to optimize the 3-D Cam surface profile by mapping the unit’s
entire operating envelope, the buyer hired Hatch Inc., a big-league consulting
outfit to run Load Reject and index tests on the units at 102 ft head which
serves to validate our work.
How
the Maintenance Program Will Work - First, an index test to benchmark unit
performance
The
turbine testing process starts with a thorough checkout of the gate and blade
control systems for dynamic responsiveness and steady state accuracy because
after all – if you can’t put the gates and blades where you want them, there’s
no point in index testing.
A
one-time setup is needed to check out the available input and output signals
and make any necessary additions or adjustments. For example, operators must be
able to manually control gates and blades to exercise the machine to the
prescribed gate and blade positions for index testing. Many turbine governors
do not have manual gate and blade controls. Most do not have an external
readout of blade position. These modifications are best accomplished by the
governor supplier.
The
overall Maintenance Program will utilize the new Hybrid Index Testing (HIT)
method that was demonstrated recently at Dorena Dam. Index test data is used
not only to tune-up Kaplan turbine head and gate to blade 3-D Cam surfaces to
maximize an individual machine’s efficiency performance but also to
characterize its overall efficiency profile for unit Condition Monitoring,
Trending and to prepare source data for plant-wide optimization schemes for
multi-unit powerplants. The objective was to optimize the entire
head-and-gate-to-blade 3-D Cam surface for a Kaplan turbine. To keep costs down
and get greater familiarity with their equipment, the powerplant staff setup
the instrumentation for the index tests.
For
this test at Dorena the governor vendor was brought in to modify the governor
to get manual control of gates and blades for index testing and to setup the
SCADA system for continuous 2-Hz scans with the desired channel listing and
order. (Forebay, tailwater, gate stroke, blade angle, flow in cfs and power in
MW). Whenever it was appropriate a specimen of the stripchart data was uploaded
to ATECo for evaluation and critique.
This
is where the thorough control system checkout comes in
Turbine
control systems have 2 modes of operation. Manual and automatic. Index testing
is conducted using Manual control, but the machine normally runs under
Automatic control. It is important that the automatic mode gets thoroughly
checked out during its normal operation. After the optimization is complete and
the control system is back on automatic, double-check to make sure it’s doing
what it’s supposed to be doing. In this case it was not.
A
problem was found, right off the bat
There
was a bug in the vendor’s blade control software that caused inexplicable erratic
behavior on startup when the blades mounted the 3-D Cam. The machine had been
running for over a year with this problem and no one had noticed it - a good
argument for having an ITB around to allow viewing these things.
+
+ 
Figure 2 Cartesian coordinate animated display of ITB monitor
during Dorena Dam Kaplan startup
This
is the Cartesian coordinate display of Blade vs Gates the first time the ITB
got some StripChart data from Dorena. When the computer programmer who wrote
the 3-D Cam program saw what it was really doing, he recognized the problem and
immediately knew how to fix it. The program got fixed and a new was copy
installed the next day. This problem was never seen again. This demonstrates
the utility value of the Cartesian coordinate display format.
The
vendor’s cam surface (on the left, below) that came with the turbine from China
was only an approximation of the final optimized surface. Its only purpose was
to allow the new owner to startup and run the machine. After the unit is up and
running it should be optimized. Four separate index-tests, each optimizing the
gate to blade relationship at a single head were run at 69, 48, 85 and 102 ft
head. These 4 gate-to-blade curves were assembled into a 3-D surface to map-out
the entire operating envelope for the turbine (Fig. 4).
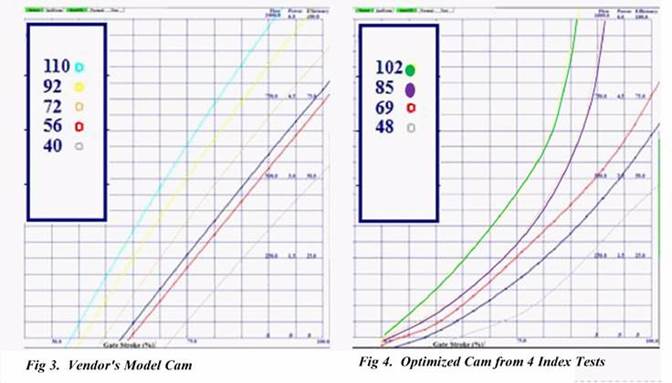
The
Dorena Dam Kaplan optimization project consisted of 4 separate index tests at 4
different heads to characterize the Optimum Cam curves across the full
head-range of the machine.
Data
Chain of Custody for ITB Hybrid Index Test Method data
This
boon came along quite by accident. Ordinarily acquiring an independent
commercial index test of this sort to validate the ITB would be an expensive
proposition ($50k and upwards), but this time we got lucky. ATECo was hired by
the seller to tune-up the 3-D Cam surface in the governor before closing the
deal. On behalf of the buyers, Hatch Inc ran the Load Reject and a separate
independent Index Test using the traditional methods. Unbeknown to Hatch Inc.
engineers, while they ran their Load Reject and index tests for the buyer the
powerplant datalogger was still streaming 2 Hz scans to memory. (If they’d have
known they’d probably have shut it off.) The recorder was always left on and
recording by the powerplant operators to capture anything interesting that may
happen to the unit… The owners and Northbrook Energy wanted to see the second
index test results so they shared the stripchart data. When asked, Hatch shared
a copy of their test report and the test data spreadsheet they used for this
commercial index test.
The
operators wanted the datalogger always recording scans at 2Hz so it captured
the Hatch’s Load Reject and index tests. A few weeks later this data was
uploaded to ATECo for analysis, and then the results were compared with Hatch’s
index test results. Because the input data was exactly the same for both tests,
the results from the two tests were also exactly the same after the
hair-splitting was sorted out. (except for a 0.4% peak efficiency
difference described below)
2017-05-16 Index Test at 102 ft gross head.wmv
Hatch
Kaplan Index Test
Report.pdf
This
comparison was discussed in detail with Peter Rodrigue, a senior engineer at
Hatch who signed off on the report.
Comparison of ITB and Hatch Dorena results with Peter Rodrigue.htm
My
answer and Hatch’s answer for the peak unit efficiency were different by 0.4%.
Contract guarantees ride on this percentage so it’s critical to get it right.
When Peter and I finished our fine-toothed comb treatment of the two sets of
calculations the conclusion was that the ITB was right and Hatch’s number was
0.4% too high. It was dismissed as a typo because the point was moot - there
was no Contract Guarantee in force so no harm, no foul.
The
question remains: After the head and blade to gate Kaplan turbine 3-D Cams are
tuned up and their efficiency profiles are delineated, what next?
Constant
Efficiency Monitor
The
example data for this next part of the presentation is a small 2-unit Francis
plant that had undergone runner refurbishment and was being restored to
service. A series of index tests were run to get data to justify going after
the Energy Tax Credit, but learned a bit more than they bargained for. This
example shows how index testing for diagnostics is a valuable protection from
loss and that a continuous efficiency monitor would have paid for itself many
times over. This video explains further: Francis
Continuous Monitor Pitch.wmv
The
ITB has a Condition Monitor mode that inputs from discreet sensors and/or a
SCADA system to compute real-time operating efficiency and then plots it on top
of the previously determined benchmark efficiency profile for the
existing head. The Condition Monitor will set off alarms if efficiency gets
outside of operator-preset limits above and below the benchmark. These animated
images show the screens on the Condition Monitor with various displays in
action.
Fig 5. Condition Monitor Display for 2 40 MW Francis turbines
The
Condition Monitor display above shows 4 stripcharts and 4 Cartesian coordinate
X-Y Displays of efficiency (kW/cfs) vs. flow (cfs). There are 2 units in this
powerplant so the X-Y graph displays were setup 2 per turbine to show both
full-range and zoom-in displays. The heavy center-line is the benchmark
efficiency profile extracted from the unit’s prior running data. The two
lighter lines above and below are computed operator-set limits boundaries. If
the computed efficiency gets outside of these limits, the dot changes color
from Green to Red and operator alarms are raised.
Fig 6. Condition Monitor Display for 1 40 MW Francis turbine
Here
is a closeup of the PI Recorder Data for one unit from this powerplant with 2
ea. 40 MW Francis units. The data scans are at 1-minute intervals 24/7.
This condition monitor shows at a glance the anticipated efficiency based on
prior running and the immediate real-time efficiency computed from current data
in real time.
Origin
and Test History of ITB
The
ITB was created as a new product at Woodward Governor Company in 1984 and has
been under continuous development ever since. Thus far on 5 separate occasions
the ITB has run side-by-side tests connected in parallel with traditional index
tests conducted and/or evaluated by government hydropower engineers. In every
case the ITB and traditional test results are in complete agreement.
The
ITB was 1st validated by field testing when its test results
agreed closely with a USACE Kaplan turbine acceptance test that had been run 2
weeks earlier at Clarence Cannon Dam.
1986-03-26 ITB Detailed Field Test (Albright)
1985-09-18 Clarence Cannon Test Report (Sachs)
A
2nd validation occurred 2-years hence when Lee Sheldon (while working
as a Hydropower Specialist at BPA) bought the first ITB from Woodward as a
commercial product to test at a dam near Portland Oregon. That demonstration
test went very well as reported by Portland General Electric (PGE) Sr. Staff
Engineer Gary Hackett who was a “Disinterested 3rd Party” who
participated in the test at Bull Run Dam (PGE-PHP-2).
1987-09-01 PGE-PHP-2 Report (Gary Hackett).
1988-05-28 PHP2 Classic Test (Sheldon)
1987-12-01 PGE-PHP-2 Report (Terry Bauman)
And
then Woodward exercised their Patent to quash all activity and the ITB project
languished on the back-burner. When the Patent expired in 2004 the ITB project
was resurrected to become a front-burner product for Actuation Test Equipment
Company.
The
3rd validation was by an index test on Unit 9 at USACE’s McNary Dam
in December 2015 that was compared to prior index testing conducted by
2005-12-12 McNary Field Test (Wittinger)
2006-01-16 McNary Field Test (Albright)
The
4th validation was by concurrent index testing at Ice Harbor Dam by
USACE HDC engineers. The government setup and ran an index test normally with
the ITB connected in parallel to record streamed data to memory, functioning as
a simple datalogger. The ITB was mis-programmed so that it recorded a test
point every few seconds instead of deriving a single steady-state data point
for 5 minutes of running time. When the data was received here the ITB was
reprogrammed to read this recorded data as if it were live field-measurements.
This method worked much better than expected and has evolved into the Hybrid
Index Testing (HIT) method.
http://www.actuationtestequipment.com/USACE_Docs/2006-03-28_ATECo_Ice_Harbor_Analysis.pdf
2006-03-28 ATECo Ice Harbor Analysis
2006-02-01 Ice Harbor data (Ramirez)
The
2 demonstrations for the government at McNary and Ice Harbor were deemed a
success but they chose not to buy it from ATECo.
2006-03-03 HOT Meeting PowerPoint (HDC).htm
The
5th validation was during the recent 4-head index test at Dorena Dam
when a traditional index was conducted by test by Hatch Inc. with the
powerplant datalogger recording 2 Hz scans. The ITB analyzed the datalogger
files used the HIT method and Hatch’s index test used the traditional methods.
The data for the exact same time intervals that Hatch took their measurements
was analyzed with the ITB. With the exact same source data
the computation routines in both methods gave the exact same answer.
2017-05-16 Index Test at 102 ft gross head.wmv
Hatch
Kaplan Index Test
Report.pdf
This
comparison was discussed in detail with Peter Rodrigue, a senior engineer at
Hatch who signed off on Hatch’s test report.
Comparison of ITB and Hatch Dorena results with Peter Rodrigue.htm
The
Next Step
Regarding
the maintenance program for 6 small hydro plants:
Here’s
a suggestion of how this could work:
Your
personnel will:
1.
setup your existing instrumentation
for an index test, adding new sensors as necessary to get the required signal
set.
2.
Reprogram your datalogger (or get
one if you don’t have one) to record 2-Hz Scans.
3.
Exercise the unit through the
requisite gate-blade pairs to execute an index test, dwelling for 3-minutes
settling time and another 5-minutes for data to record at each gate-blade pair.
4.
At any step in this process send a
sample of the datalogger recording to ATECo for spot-evaluation and critique.
(There is no charge for these.)
5.
Send the index test data to ATECo
for analysis and evaluation. (Up until this point no charge because the work as
all been done by your personnel).
6.
When a full set of turbine data is
reduced to a new cam-surface Best-Cam line for the tested head, the final
evaluation to get the 2-D Cam profile curve to put in the 3-D Cam costs $5k.
7.
This new cam curve will be merged into
the existing 3-D Cam, profile and returned. Send me as sample of your data
format and the new data will match it.
8.
As soon as you install the new cam
surface in the machine, rerun the index test procedure and upload the data to
ATECo.
9.
This new data will be analyzed and
computed with the before data for the unit to demonstrate how muck the index
test and optimization had helped.
10.
The deliverables ATECo will provide
will be:
·
A report of diagnostic observations
from the stripchart and X-Y Plotter
·
A data table of the SteadyState data
points gleaned from the continuous data recordings
·
A new on-cam curve to plug into the
3-D Cam for the tested head
·
If you provide your entire current
surface a new surface profile will be created by morphing the new data curve
for the tested head into it.
·
Before and after efficiency profiles
for the unit
·
Stripchart data.
How
to begin
The
first step is to inventory the turbine equipment.
1.
What kind of turbine is it?
2.
How many units are in the
powerplant?
3.
What kind of governors do they have?
4.
Is there a SCADA system?
5.
Is there a Data Logger?
And
then let’s talk about it and make a more specific plan.
Best
regards,
Douglas
Albright
Actuation
Test Equipment Company
(815)
335-1143