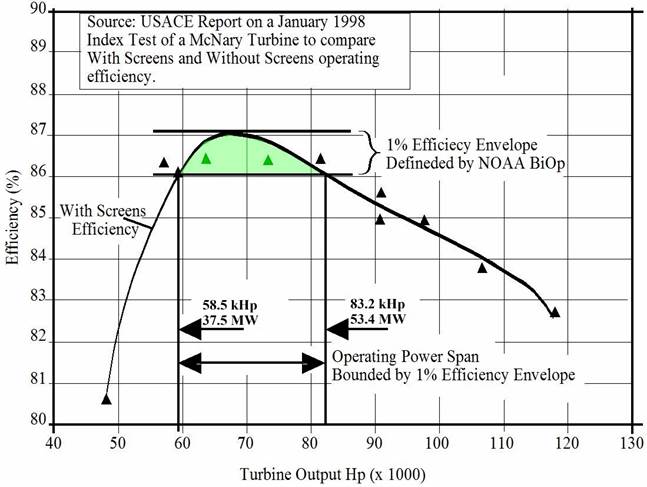
Fig 1. NOAA Fisheries 1% Efficiency Envelope shows the safe-zone
from 37.5 to 53.4MW.
Marine biologists have correlated fish survival rates with operating efficiency of Kaplan hydroelectric turbines as shown in Fig 1.
This chart shows the generic data profile to anticipate, but for optimum return on investment from a hydroelectric facility the individual turbines must all be index tested and optimized and then each Kaplan turbine must have their own unique head-and-gate-to-blade-angle 3-D Cam surface profile derived and installed in its control system. This surface should be re-defined quinquennially (every 5-years) by index testing and optimization and the new surface installed.
The rule for fish mortality mitigation is that during the intervals designated by NOAA Fisheries for spilling, this turbine can only be operated inside the vertical Power Span Bounded by the 1% Efficiency Envelope.
It has been said that the peak output power point nor the peak efficiency point will result in best fish survival.
The logic could be that the vacuum on the back-side of the runner blade with a steep angle of attack that changes the direction of the flow-vector more abruptly, increasing efficiency while also making it more lethal.